How to calculate the mean of a data set in microsoft excel? Step by step guide
Although it is true, Excel is a program that is part of the renowned Microsoft Office suite and consists of spreadsheet software that, in general, is used to carry out mathematical and / or financial tasks based on any environment (academic, professional, business, etc.).
In that sense, it offers the possibility of performing all kinds of numerical calculations to manage any data flow effectively . For this reason, it allows you to do simple mathematical operations and among these, you can find the average of a set of numbers, easily and quickly.
Therefore, if you need to generate reports in which you must present the mean of in a certain data set, it is recommended that you use Excel for this. So, in order for you to carry out the necessary procedure correctly, in this post we explain how to obtain said numerical information through this program .
What is an average or average in Microsoft Excel and when is it necessary to obtain it?
In mathematics and statistics, an average or average also known as “the arithmetic mean”, refers to that result that is obtained when performing a division with the sum of various quantities by the digit that represents them in their entirety, basically. In other words, it is the characteristic value of a series of quantitative data .
In other words, it is a number that results from the study or the sum of a set of values by dividing it by the number of addends . Therefore, it consists of a finite value that, in order to obtain it, it will be necessary to have at least two related quantities, in order to discover its midpoint.
However, thanks to its usefulness for different studies, the mean has been classified as a digit of great interest, due to the fact that it is able to measure the central tendency or the location of the center of a group of numbers within a statistical distribution .
Thus, it will be necessary to calculate an arithmetic mean in the following cases:
- In education, it is usually used to obtain the indicator of a student’s academic level .
- It also allows you to verify the average value of the profits that a company acquires during a year or at any time interval.
- It is used to know the average of the days that a certain employee works and those that he does not .
- In environmental terms, it is useful to measure the central tendency of the temperature during a day or a week, for example.
- It is a very juicy digit for conducting research based on economics. Like, for example, the average of inflation rates .
For its part, to better understand the concept of an average, it is worth presenting a small sample of how this numerical value works below:
- First of all, you have a group of digits that are: 2, 4, 6, 8, 10 and 12 .
- So, once you do the summation of this set of numbers, you can get a total of 42 .
- Now, it is verified that 6 numbers are part of this set. Well, all that remains is to divide the sum by the total number of digits there are, which would be: 42 by 6, to obtain an average of 7 .
Steps to get the mean of a data set in Microsoft Excel
However, despite the fact that it is a very simple numerical operation when there are few numerical data to relate, the truth is that this is notably complicated by having to calculate the average between a much larger set of digits . Therefore, Microsoft Excel has designed a function that allows it to be done automatically .
In this sense, to enjoy remarkable simplicity when managing your numerical data and to be able to calculate the mean of said set of values, it is important that you know how to carry out the procedure from Excel, in a timely manner and here, you We mention each step to follow :
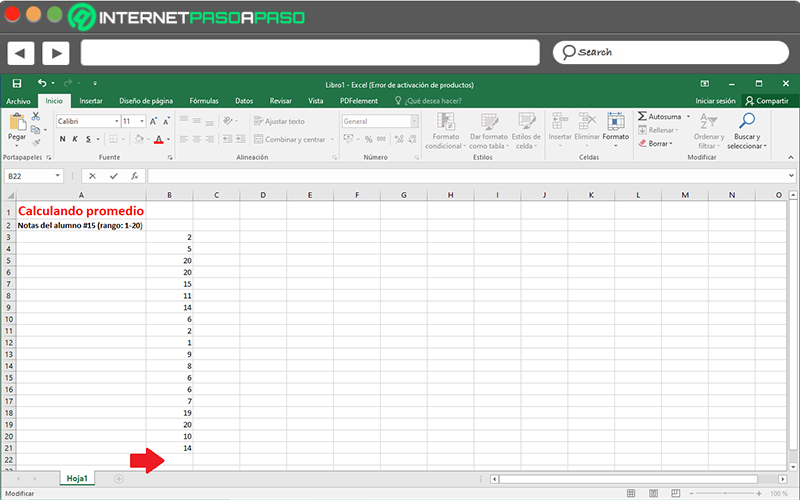
- To compute the arithmetic mean of several numbers found in a contiguous row or column in an Excel sheet, you must start by accessing the program document where the data to be studied are .
- After that, you have to click on a cell located below or to the right of the numbers (which will depend on how they are arranged, either horizontally in rows or vertically in columns). In this case, we will have to click on a cell located below .
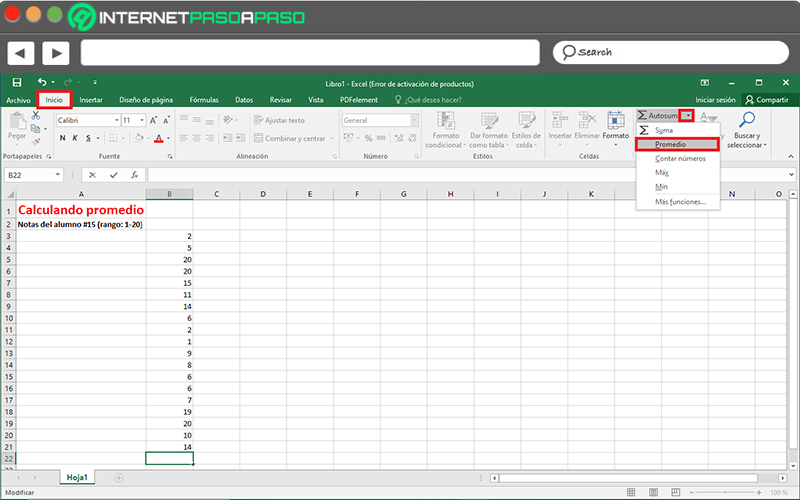
- Next, it is time to select the “Home” tab from the options ribbon, and then click on the arrow located in the “AutoSum” option (located in the Modify group) and within the options that are displayed, just do click on “Average” .
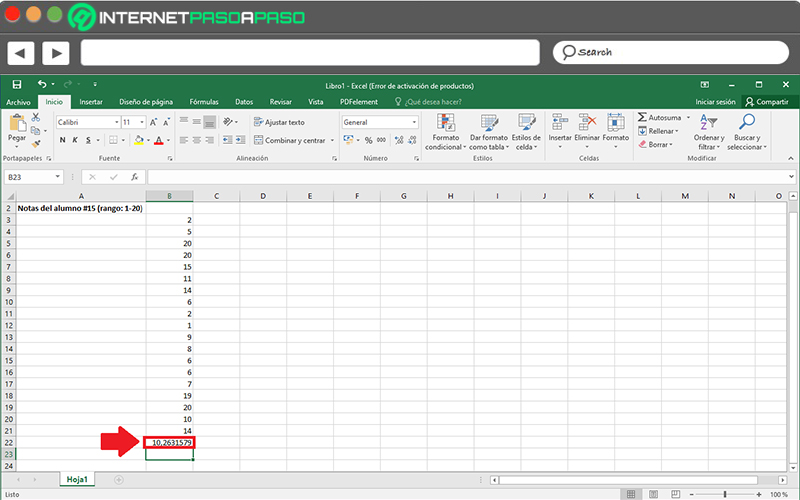
- Finally, automatically, the entire row or column where the digits to be calculated are expressed will be selected and at that moment, you have to press the Enter key .
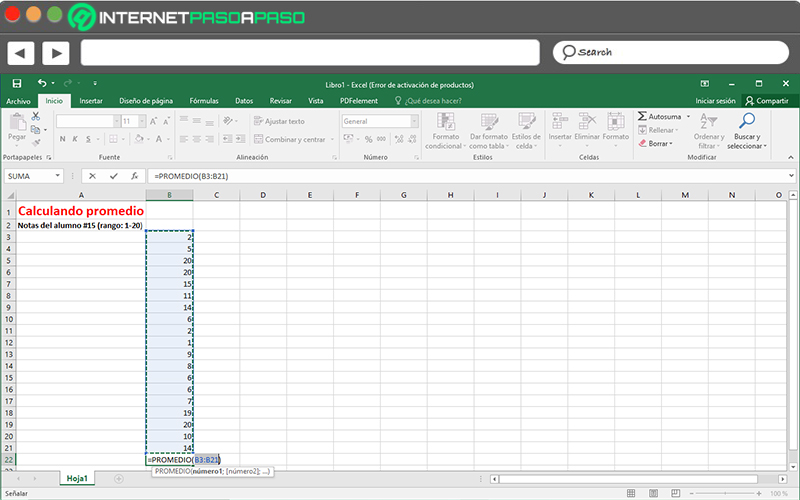
- Once this is done, right in the cell you have chosen at the beginning, you will obtain the central value or the arithmetic mean .
In addition to this mechanism to follow, there is also another more practical way to calculate the mean of a set of numerical values using Microsoft Excel. Next, we explain what it consists of:
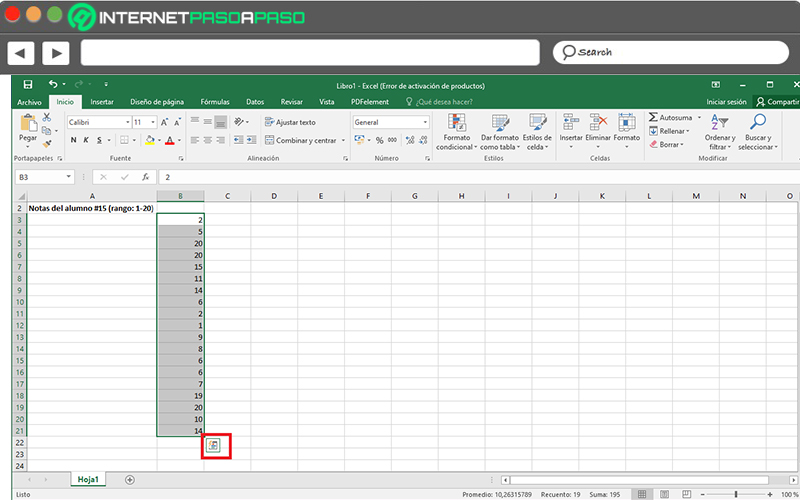
- First of all, find and enter the spreadsheet document where all the data to be averaged are found.
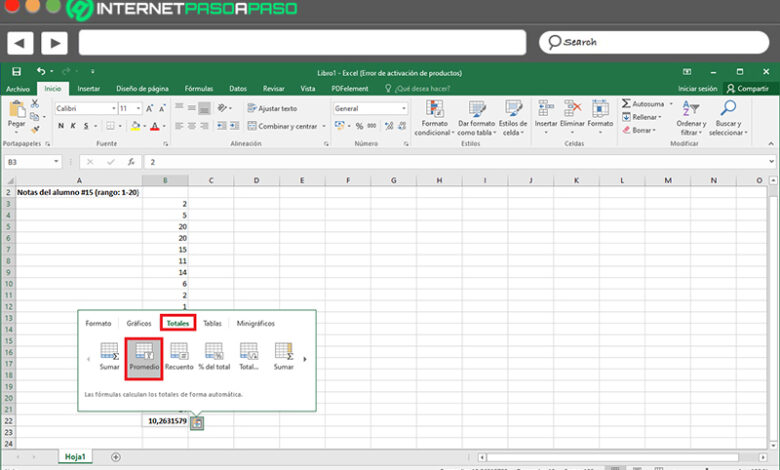
- Followed by this, select the entire row or column of said digits and click on the box shown in the lower right corner of the last cell (in this case because it is vertical).
- Now, among all the options shown below, click on the “Totals” tab and there, press where it says “Average” . Immediately, that value will be displayed in the next cell.
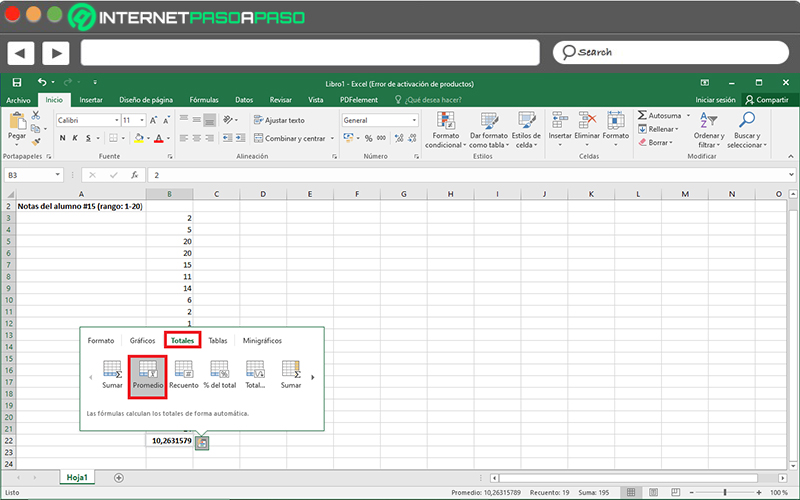
As you will see, this last procedure is a much faster way to obtain and / or calculate the arithmetic mean of any set of data exposed in a Microsoft Excel sheet. Taking into account that, whatever route you take for it, the result will be the same using this program .